




Every car loses value from the day you buy it, and that loss is money you won't get back when you sell. A used car is worth about 10% less for every extra year of age, and the cheapest age to buy is around three. That's what the asking prices of 41,298 used cars, along with which models hold their value and what mileage really costs. We always compare like with like: each car against others of the same model and specification.
Key findings
- About 10% a year. A used car is worth about 10% less for every extra year of age. For one particular car, which keeps its version as it ages, the loss is closer to 8% a year.
- Buy at around 3. A 3-year-old car loses 23% of its price over the next 3 years, against 25–31% for cars bought at any other age.
- The model matters more than the badge. Models lose between 6% and 14% a year, even within one brand. A Mercedes GLB loses 5.3% a year, an E-Class 12.8%.
- Mileage is priced fairly. At the same age, 10,000 miles take about 4.7% off the price. Low mileage isn't a bargain, and high mileage isn't a trap.
How much value a used car loses each year
A used car is worth about 10% less for every extra year of age, based on our comparison of cars of the same model and specification. The true figure almost certainly sits between 9.7% and 10.3%, which we call the likely range. So you can treat 10% as a reliable rule of thumb when you size up any car.
Age itself does most of the damage. At identical mileage, one extra year still costs 7.3% of a car's value. That's about three-quarters of the yearly loss, and the rest comes from the miles a typical car adds over the year.
Our data shows how much age costs, not why. The likely reasons are that newer models and facelifts make an older car look dated, and the manufacturer warranty on many cars ends around year 3.
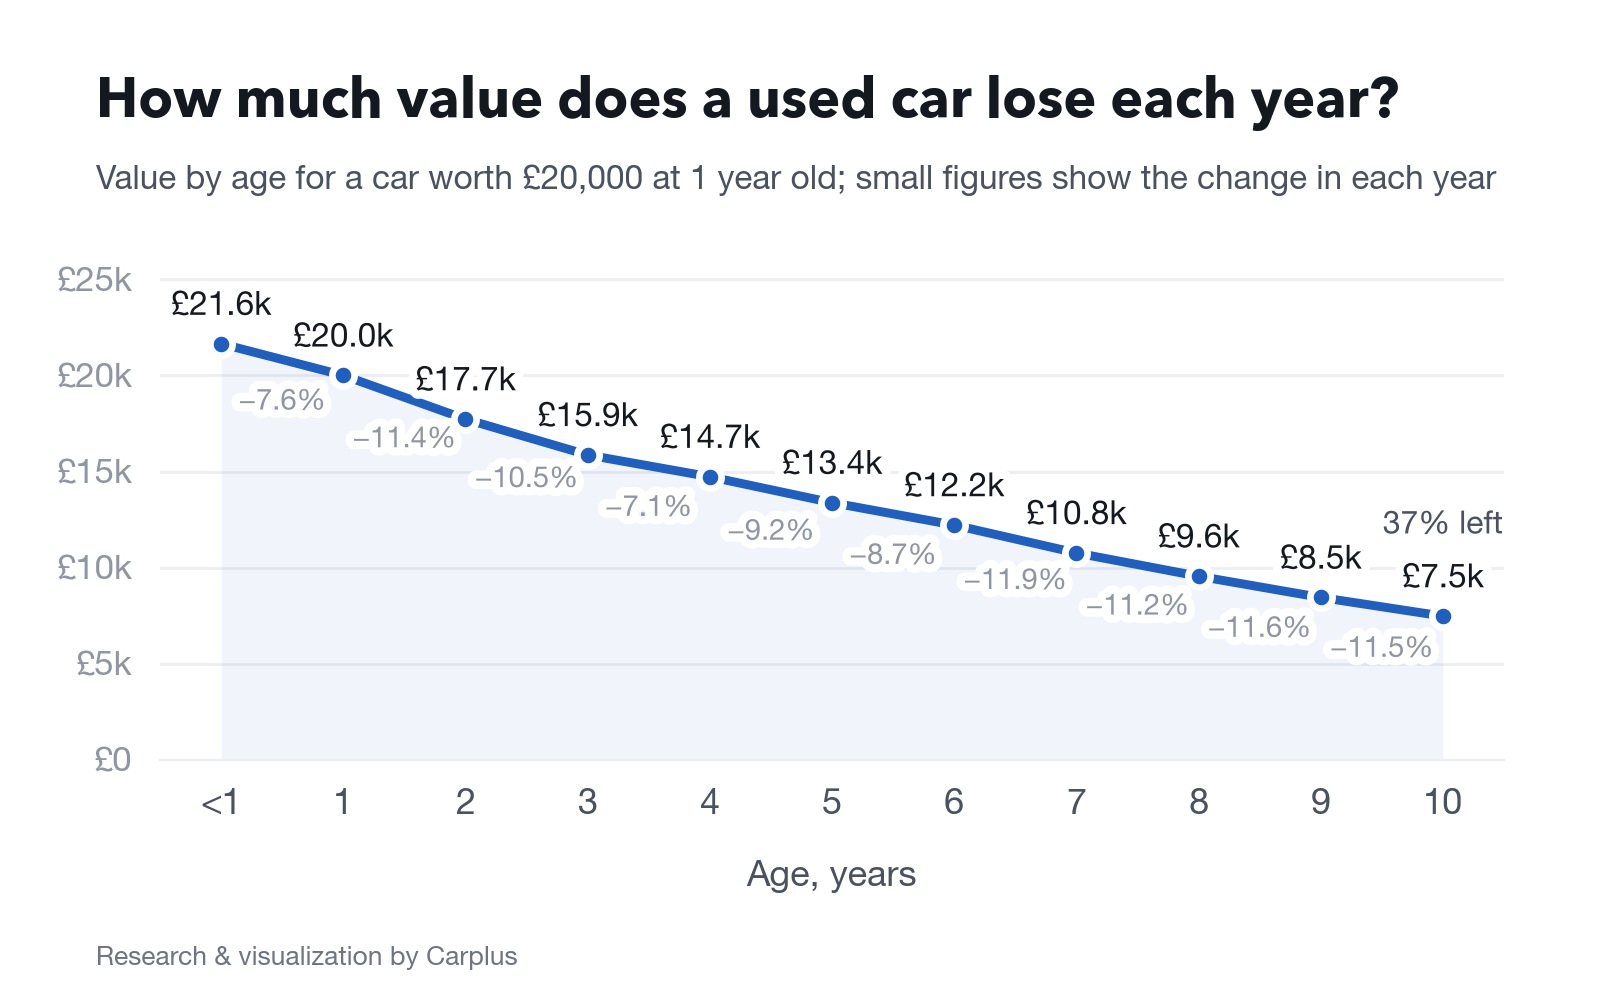
What does that mean for a real car? Take one worth £20,000 at 1 year old. At what cars of each age sell for today, it's worth £15,862 at 3 years, £10,765 at 7 and £7,482 at 10, just 37% of its 1-year-old value.
A used car is worth about 10% less for every extra year of age. What cars of each age sell for now, same model and specification, scaled to a car worth £20,000 at 1 year old.
The yearly percentage stays fairly steady, at between 7.1% and 11.9%. But the amount you actually lose shrinks as the car ages, because each year's percentage comes off a smaller price. The second year costs £2,275. By the tenth, it's down to about £970.
The gentlest stretch comes as a car turns 4, 5 and 6, when it loses 7% to 9% a year. From the year it turns 7, the pace picks up again, to 11% or 12%.
How much will your own car lose?
Your own car is likely to lose about 8% of its value a year. When we compare cars of exactly the same version (same engine and equipment level, or trim), a year costs 8.3%.
The 10% headline is a little higher for a simple reason. Younger cars on sale are more often a newer generation (a redesigned version of the model) or a better-equipped version, and both cost more to begin with.
The best age to buy a used car to lose the least value
The best age to buy a used car is 3 years old, because a car bought then loses the least value over the next 3 years. It sheds 23.0% of its price in that time. On a car worth £20,000 at 1 year old, that's £1,216 a year.
The cheapest car to own is one bought at 3 years old. Value lost per year over the next 3 years, by age at purchase, for a car worth £20,000 at 1 year old; percentage inside each bar is the share of the price lost, thin lines show the likely range.
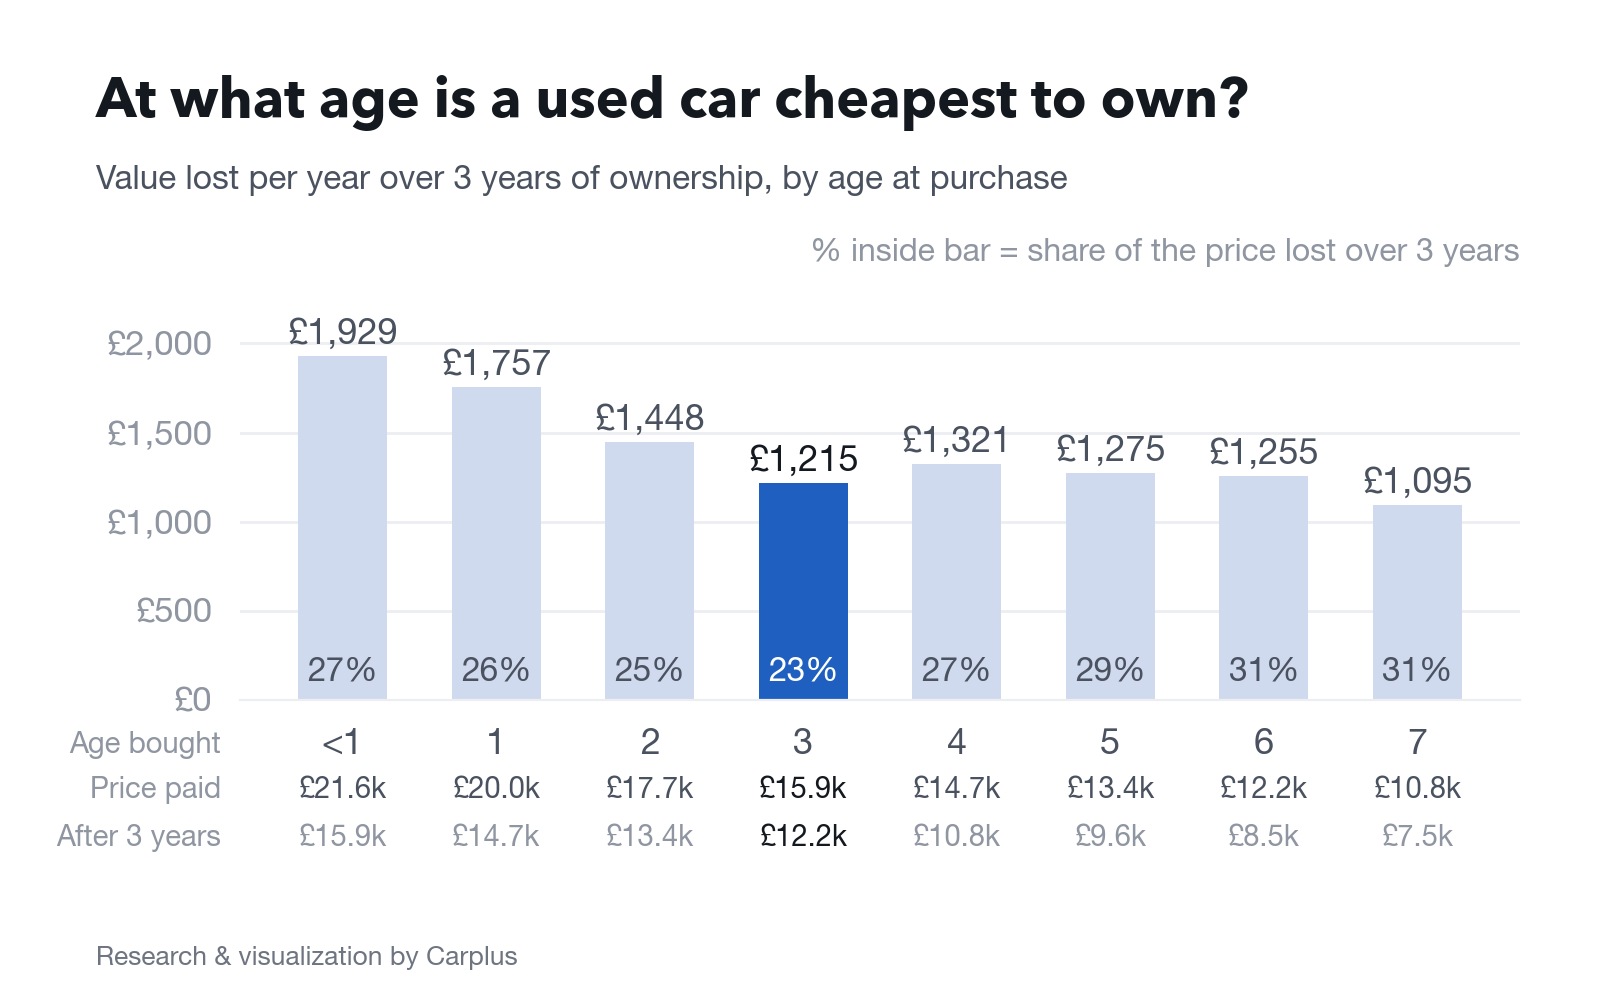
Why three? By then the car is past the steep early years, and you'd own it as it turns 4, 5 and 6, the flattest part of its value curve. One likely reason for the timing is that many cars come back from finance deals and leases at around 3 years old.
If you'd rather have a newer car, 2 years old is the next best pick, losing 24.5% over the same stretch. That's about £230 a year more than buying at 3, on a car worth £20,000 at 1 year old.
Buying at 7 costs the least each year, at £1,094. That said, it's 30.5% of a smaller price. You'd also finish up with a 10-year-old car that has around 70,000 miles on the clock.
Keep in mind this describes today's market. It compares cars of different ages on sale in 2026, so the best buying age could shift a little as prices move.
Each model also has its own value curve. For the car you're eyeing, the best age can come earlier or later than 3.
Which car models lose value fastest
The Land Rover Discovery Sport loses value fastest of the models we measured, at 14.0% a year. That's more than twice the 6.0% a year of the SEAT Arona, the slowest. Most cars sit in between: four in five models lose between 8% and 12% a year.
Take two popular cars. Between 1 and 3 years old, a Nissan Qashqai loses 27% of its price and a Volkswagen Polo just 18%. At 4 years old the Qashqai is worth 69% of its 1-year-old price, the Polo 78% and the average used car 74%.
A Nissan Qashqai loses value faster than a Volkswagen Polo. Share of its 1-year-old price a car is worth in its first 4 years, same model and specification, with the likely range shaded. Each model is the same generation throughout these ages.
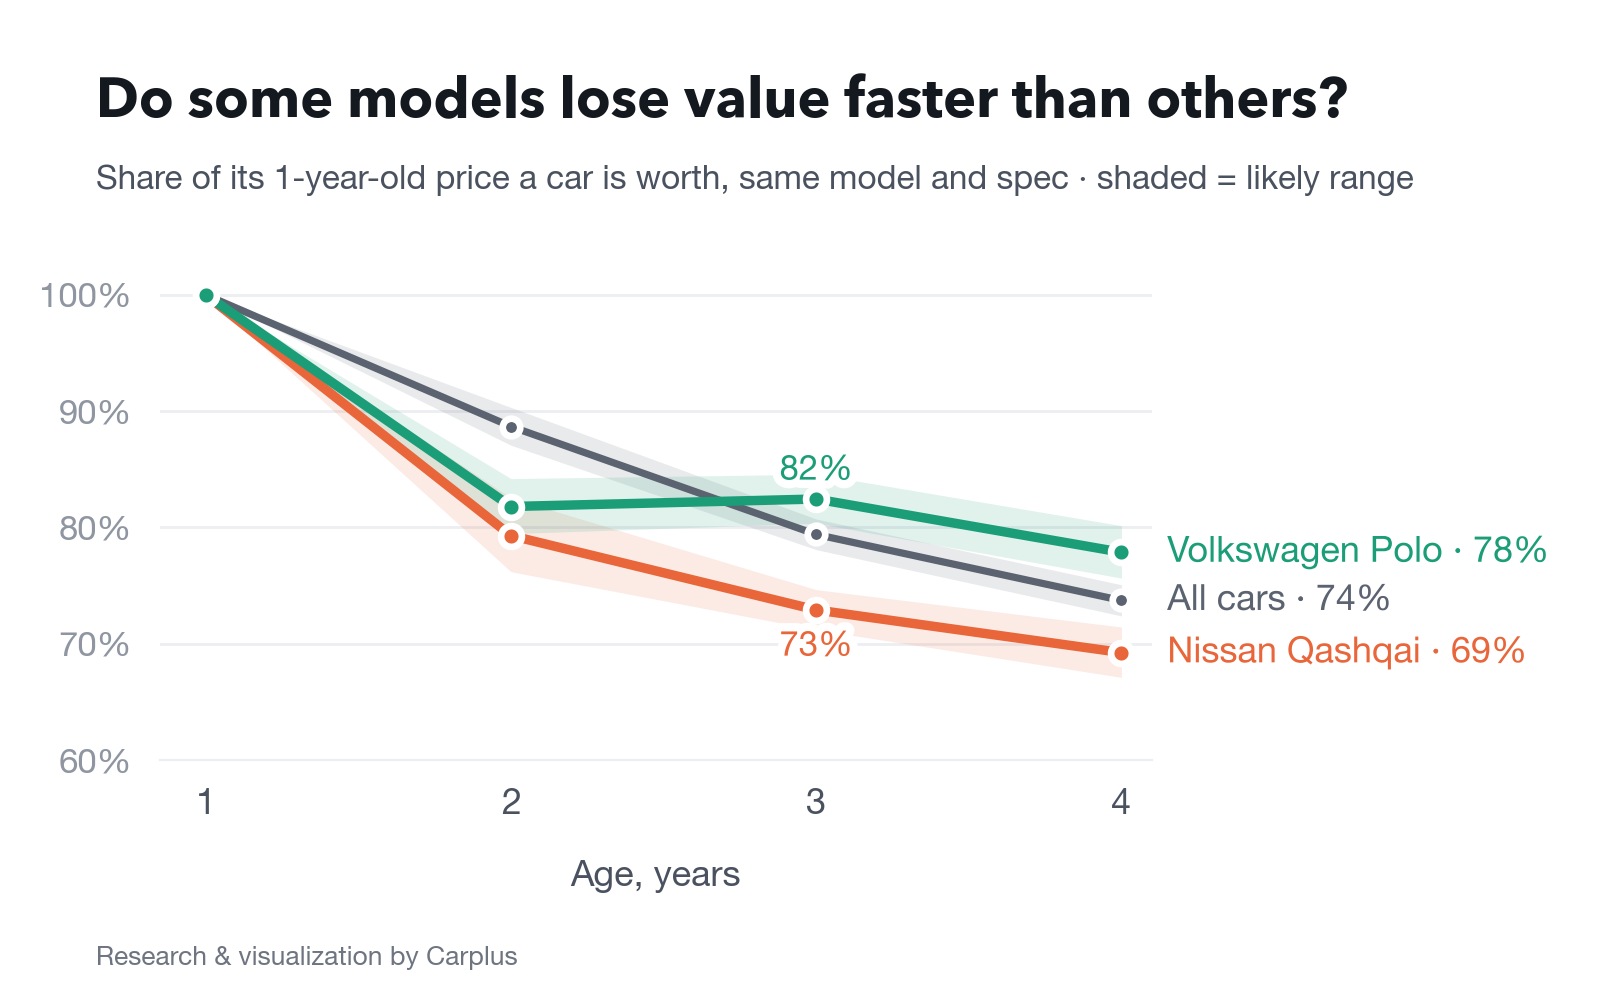
When a model loses most is harder to pin down. Some models seem to lose most early and others late, but often that's a new generation arriving.
Once a new generation goes on sale, the old one steps down in price. On a model's value curve, that step looks like a sudden loss with age, but it doesn't happen to a car you already own.
Compared version by version, only five models keep a clear pattern. The Mercedes GLC, Toyota C-HR and Hyundai Tucson lose most in their first years, so they may be better bought a little older. The BMW X3 and Kia Sportage lose most after year 7, so you may be better off selling one before then.
Which car brands hold their value best
SEAT holds its value best of the top 20 brands, losing 7.5% a year, while Land Rover loses value fastest, at 12.7%. At 10 years old, a SEAT is still worth 46% of its 1-year-old price, a Land Rover just 29%.
SEAT holds its value best, Land Rover worst. Value lost per year of age, same model and specification; top 20 brands, with value lost a year at each brand's typical price and value left at 10 years (1 year old = 100%).
SEAT, Toyota, Mazda, MINI, BMW and Land Rover are the only brands whose gap from the 10.0% average is too big to be chance. The other 14 brands sit close to the average, from Volkswagen (8.8%) to Peugeot (10.7%).
A brand's figure is only the average of its models, though. Models of one brand can sit far apart:
| Brand | Holds value best | Loses value fastest |
|---|---|---|
| Mercedes-Benz | GLB, 5.3% a year | E-Class, 12.8% a year |
| Toyota | Yaris Cross, 6.1% a year | RAV4, 10.0% a year |
| Ford | Puma, 8.2% a year | Kuga, 11.4% a year |
So check the model, not just the badge. In Part 2, we list the models that hold their value best and worst.
A brand with an average rate can still cost you plenty on a pricier car. Volvo loses an average share of its value, which comes to £2,553 a year at its typical price. Mercedes-Benz is similar, at £2,032 a year.
There's one caveat for premium brands. Our listings stop at £42,000, so the youngest and priciest Mercedes-Benz, BMW, Volvo and Land Rover cars are thin on the ground in our data. Their real loss in the first years is probably bigger than shown here.
How much mileage knocks off a used car's value
Mileage takes about 4.7% off a used car's value for every 10,000 miles, compared with a car of the same model and age. On a typical car priced at £15,298, that's about £73 for every 1,000 miles. So when two similar cars on your shortlist have different mileages, you can check whether the price gap between them is fair.
Age and mileage together take 8.3% per 10,000 miles. That's because higher-mileage cars also tend to be older, so the two losses stack up.
The first miles barely count, and the cost grows faster the further up the clock you go. A car with 10,000–20,000 miles is worth just 2.7% less than one with under 10,000, but at 100,000–120,000 miles the gap reaches 40.1%.
Every 10,000 miles takes 4.7% off the price. Value by mileage for the same model, specification and age (blue) and ignoring age (grey), as a share of the price of the same car with under 10,000 miles.
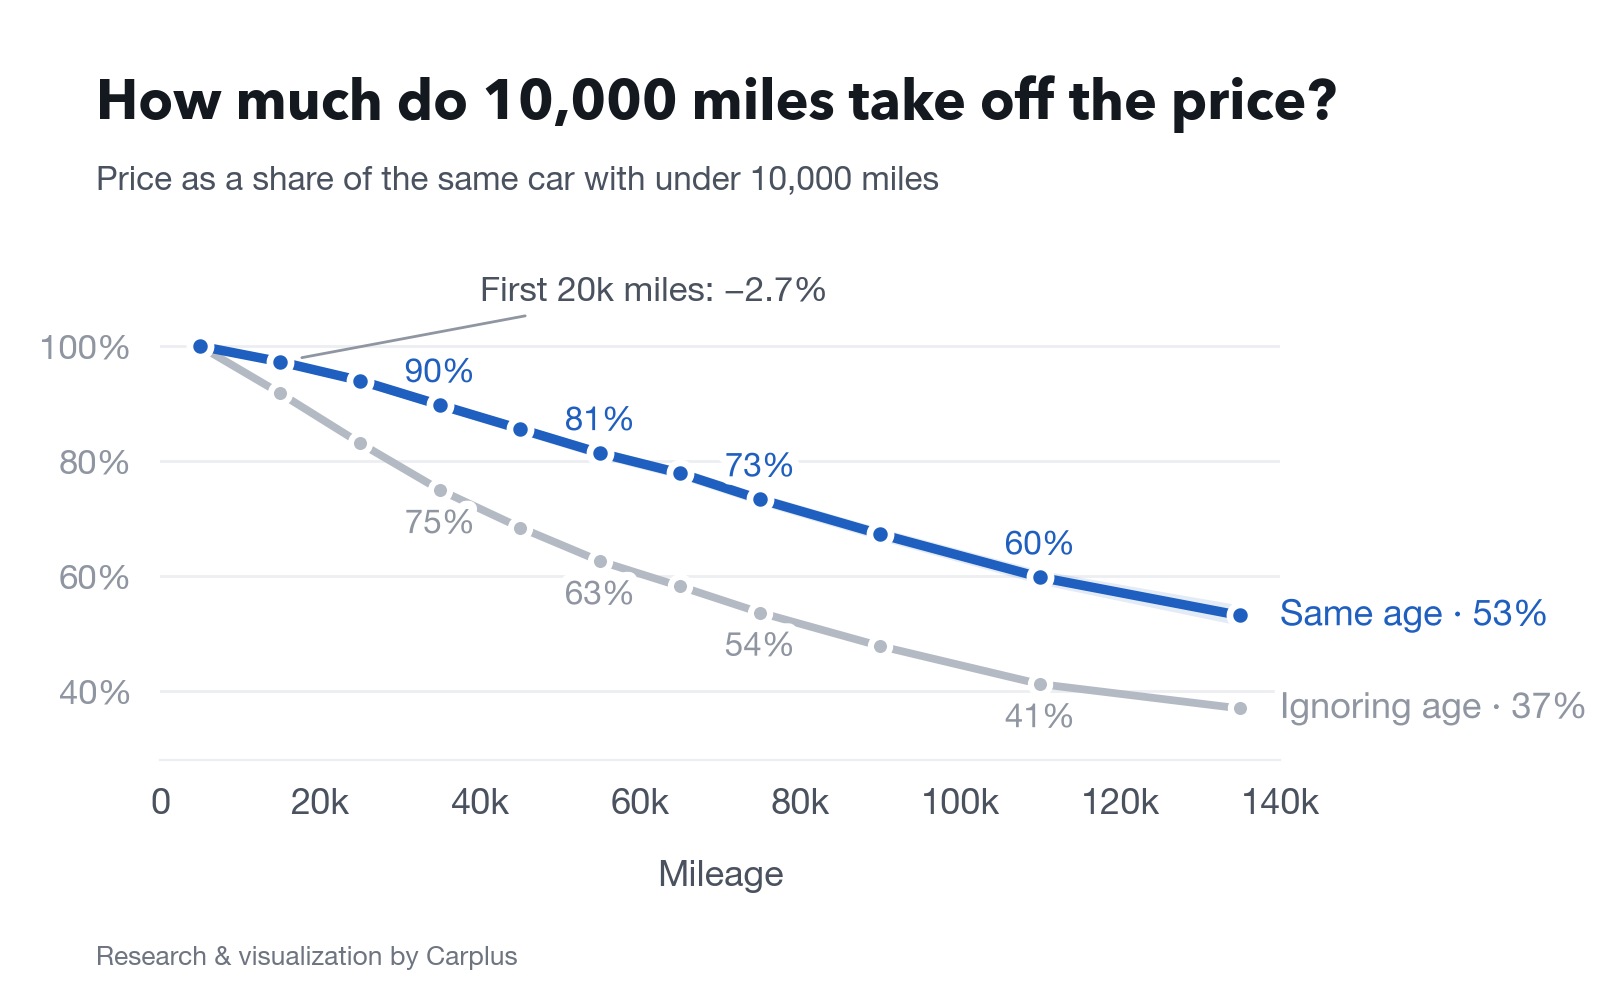
Every 10,000 miles takes 4.7% off the price. Value by mileage for the same model, specification and age (blue) and ignoring age (grey), as a share of the price of the same car with under 10,000 miles.
Is a high-mileage car a bad buy? Not if it's priced fairly. Cars driven more than 14,000 miles a year sell for 20.3% less, close to the 19.6% their extra miles predict. That means you're paying a fair price for the miles, so a high-mileage car is neither a hidden bargain nor a trap.
Low-mileage cars are priced fairly too. Cars driven under 4,000 miles a year cost 7.8% more, close to the 7.0% their lower mileage is worth. So a low-mileage car isn't a bargain either: you simply pay for the miles it hasn't done.
The typical car covers 6,400 miles a year. At that rate, mileage accounts for only about 3 points of the 10% a car loses each year. Age matters far more.
Some brands also get driven far more than others. A typical Volvo covers 7,546 miles a year and a BMW 7,333, while a Toyota covers just 5,297. That's why a low-mileage Toyota is easy to find, while a low-mileage BMW takes more hunting.
Do cars in high insurance groups lose value faster?
Cars in insurance group 31 or above lose value faster than the rest, at 11.5% a year. Groups 1 to 30 all lose value at a similar pace, between 8.8% and 9.8%. Insurance groups run from 1 to 50. The higher the group, the higher the premium usually is.
Cars in insurance group 31 and above lose value fastest. Value lost per year by insurance group (typical model in the group, thin lines show the likely range), with the loss over 3 years on a £15,000 car.
On a £15,000 car, a group 31+ model loses about £4,600 over 3 years, against £3,600 for a group 11–15 model. That's £1,000 more, on top of a higher premium.
The high group itself isn't what costs you value, though. All 18 models in groups 31+ come from premium brands, most of them are big diesels, and seven are a Land Rover or a Jaguar. Allowing for the kind of car explains about half of the gap, and what's left is too small to be sure of.
Still, a high group is a useful warning sign. Whatever the cause, it means a bigger premium every year and, in today's market, a bigger loss when you sell. These group 31+ models lose value fastest:
| Model | Insurance group | Value lost a year |
|---|---|---|
| Land Rover Discovery Sport | 35 | 14.0% |
| Jaguar F-Pace | 35 | 13.4% |
| Range Rover Evoque | 33 | 12.8% |
| Mercedes E-Class | 37 | 12.8% |
| BMW 4 Series | 31 | 12.7% |
At the other end, these models sit in group 15 or below and lose the least value each year. They're likely to be cheaper to insure, too:
| Model | Insurance group | Value lost a year |
|---|---|---|
| SEAT Arona | 12 | 6.0% |
| VW Taigo | 15 | 6.1% |
| Toyota Yaris Cross | 12 | 6.1% |
| Fiat 500 | 8 | 6.9% |
| VW T-Cross | 12 | 7.1% |
| Nissan Juke | 13 | 7.1% |
| Toyota Aygo X | 6 | 7.4% |
| Toyota Yaris | 14 | 7.5% |
| Toyota C-HR | 15 | 7.5% |
| VW Polo | 9 | 7.7% |
Your actual premium depends on you as well as the car, so get a quote before you commit.
Young car with high miles or old car with low miles: which costs more?
An older car with low miles costs more than a young car with high miles, once you weigh what each one gives you for the money. Dealers often price them the same, but the young car is several years newer, and those years are worth more than the extra miles it has done.
What does the same money buy? Same model, fuel and gearbox at the same price: a 2 to 3-year-old car doing over 15,000 miles a year, or a 7 to 8-year-old doing under 4,000.
At the same price, you really can choose between the two. We found 772 pairs of the same model, fuel and gearbox at almost identical prices, each with one young high-mileage car and one older low-mileage car. Typically, about £12,500 buys either a 3-year-old car with 57,000 miles or a 7-year-old with 24,000.
| Model | Typical price | Young, high miles | Older, low miles |
|---|---|---|---|
| Vauxhall Corsa | £10,180 | 3 years, 58,000 miles | 7 years, 18,000 miles |
| Ford Fiesta | £11,000 | 3 years, 59,000 miles | 7 years, 23,000 miles |
| Nissan Juke | £12,000 | 3 years, 55,000 miles | 7 years, 24,000 miles |
| VW Polo | £12,800 | 2 years, 54,000 miles | 8 years, 25,000 miles |
| VW Golf | £16,800 | 2 years, 54,000 miles | 8 years, 24,000 miles |
| Mercedes A-Class | £18,080 | 3 years, 57,000 miles | 7 years, 24,000 miles |
On age and mileage alone, that 3-year-old should cost about 15% more than the 7-year-old. Each extra year takes 7.3% off a car's value, while each extra 10,000 miles takes only 4.7%, so the 4 years between them outweigh the 33,000 miles.
Yet dealers price the two cars the same. That means you pay a premium for the older car's low mileage.
How does unusual mileage change the price? Same model, age and specification, against a car doing a typical 4,000 to 9,000 miles a year, by age of car.
That premium grows as a car gets older. Here's how unusual mileage changes the price of a £15,000 car, compared with the same model at the same age doing typical mileage:
| Age | Under 4,000 miles a year | 9,000–14,000 miles a year | Over 14,000 miles a year |
|---|---|---|---|
| 1–3 years | +5% (+£720) | −6% (−£970) | −15% (−£2,260) |
| 4–6 years | +7% (+£1,080) | −11% (−£1,690) | −24% (−£3,570) |
| 7–10 years | +16% (+£2,390) | −17% (−£2,520) | Too few cars |
The gap widens because the difference in miles builds up every year. That's why a 7 to 10-year-old car doing under 4,000 miles a year costs 16% more than one doing typical miles. On a 1 to 3-year-old car, the premium is just 5%.
Cars with unusual mileage aren't rare. About 16% of 7 to 10-year-old cars for sale do under 4,000 miles a year. At the other end, 7% of 1 to 3-year-old cars do over 14,000.
The older car is likely to cost more to own, too. A car loses value faster from about its 7th year, and its low-mileage premium will probably shrink as you add your own miles.
That's why the young high-mileage car is our pick for most buyers, as long as its service history is full. An older low-mileage car is worth the extra only if its MOT history, which records the mileage at every test, confirms the low figure is genuine.
Which used car to buy if you want to lose the least value
A used car around 3 years old, of a model that holds its value, will lose you the least money. Five rules follow from our data:
- Aim for a car around 3 years old. On a car worth £20,000 at 1 year old, buying at 3 costs about £1,216 a year in lost value, against £1,449 at 2 and £1,322 at 4.
- Choose the model, not the badge. Models lose between 6% and 14% a year, and two models of the same brand can sit far apart. Check how the model you want holds its value.
- Pay for mileage by the mile. At the same age, 1,000 miles are worth about £70 on a £15,000 car. Don't pay more than that for very low mileage, and don't rule out a high-mileage car that's priced for its miles.
- Expect your own car to lose roughly 8% to 10% of its value a year. It loses more in the first years and less between 4 and 6.
- Treat insurance group 31+ as a warning. On a £15,000 car, expect to lose about £1,000 more over 3 years, on top of the higher premium.
Found the right car? Check your finance options – we use a soft search, so there's no impact on your credit score.
Further detail: how we measured and how solid the figures are
How we measured how fast used cars lose value
We compared the asking prices of 41,284 used cars for sale. We collected them between June and October 2026, most of them in the first two weeks of June. Cars listed on both sites count only once.
We measure each car against others of the same model and specification (same fuel, gearbox, body style and engine size). So a pricier trim or a bigger engine can't skew the result, and you can use these figures as a fair benchmark for the car on your shortlist.
- Cars: 1 to 10 years old, across 485 models.
- Prices: between £4,000 and £42,000, so the youngest and priciest premium cars are thin on the ground.
What our data can't tell you
- These are dealer asking prices, not final sale prices, and private sellers aren't included.
- Most listings come from early June, so the figures are a snapshot of one moment in the market.
- We compare cars of different ages on sale at the same time, rather than following one car over the years. "A year older is worth 10% less" isn't the same as "this car will lose 10% next year" if the whole market moves.
How stable the figures are
Our headline figure barely moves when we split the data. On two random halves of the cars, a year of age cost 9.98% and 10.00%. We also re-measured every headline figure on two halves of the models, without any single big brand and without unusually priced cars, and got the same answer each time.
The best buying age holds up too. When we re-ran it on 200 random reshuffles of the models, 3 years came out best 99% of the time. Buying at 2 loses about 1.5% more of the car's price over 3 years than buying at 3, and buying at 4 about 3.8% more.
The same goes for models and brands. A model's pace measured on one half of the cars closely matches the other half, so models that lose value fast keep doing so. Each brand gave the same figure on both halves, to within 0.4% a year.
When we compare 20 brands at once, we only call a brand faster or slower than average if the gap still holds after allowing for that many comparisons.
Mileage doesn't explain the brand gap
Premium cars do cover more miles, but that isn't what drives their faster loss. At equal mileage, Land Rover still loses 9.6% a year and BMW 8.6%. SEAT, Mazda and Toyota stay at the bottom, losing between 4.8% and 5.6%.
Which car brands lose the most value from high mileage
Ford loses the most value from high mileage of the top 20 brands, at 5.8% per 10,000 miles, while MG loses the least, at 3.4%. That matters if you drive a lot, because the badge you pick changes how much each mile costs you when it's time to sell.
Miles hurt a Ford most and an MG least. Value lost per 10,000 miles at the same age, same model and specification; top 20 brands, with cost per 10,000 miles at each brand's typical price and typical miles a year.
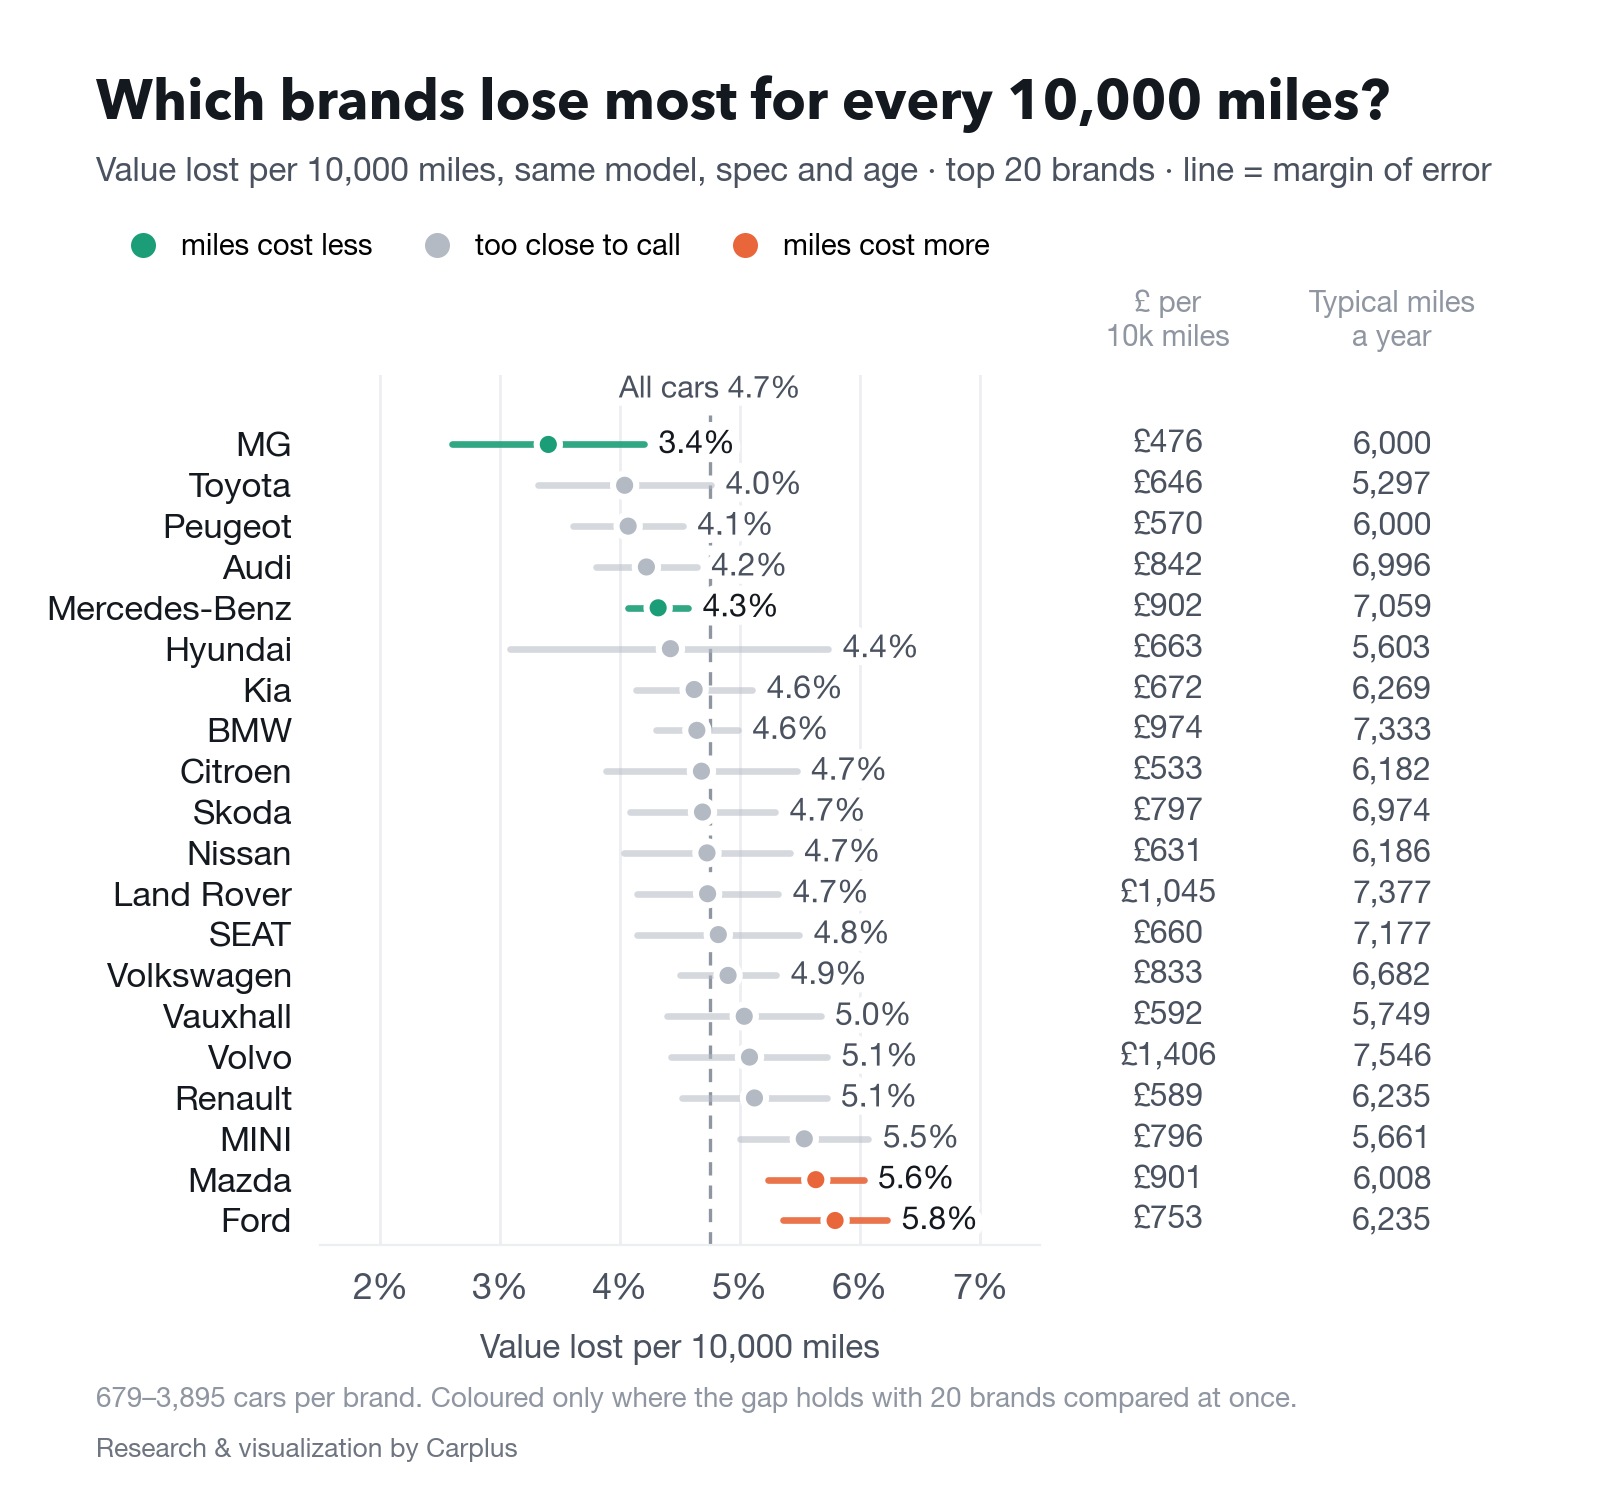
Only four brands differ from the 4.7% average by more than chance: miles cost Ford (5.8%) and Mazda (5.6%) more, and MG (3.4%) and Mercedes-Benz (4.3%) less. Peugeot, Audi and MINI look different, but not by enough to be sure.
The pricier the car, the more each mile costs you, because the same percentage comes off a bigger price. A Volvo loses £1,406 for every 10,000 miles at its typical price, a Land Rover £1,045 and a BMW £974. An MG loses £476, about a third as much as a Volvo.
The bottom line
Every car loses value, but how much yours loses is largely up to you. The age you buy at, the model you choose and what you pay for its miles can add up to thousands of pounds by the time you sell.
So start with a car around 3 years old, check how that exact model holds its value and pay a fair price for its mileage. Get those three right, and the badge matters far less than most buyers think.
In Part 2, we look at what sets a model’s pace, its size, its brand and its fuel, and list the models that hold their value best and worst.
Found the right car? Check your finance options – we use a soft search, so there’s no impact on your credit score.
Table of Contents